Day 1

Day 1

Introduction to Path Analysis and Mplus

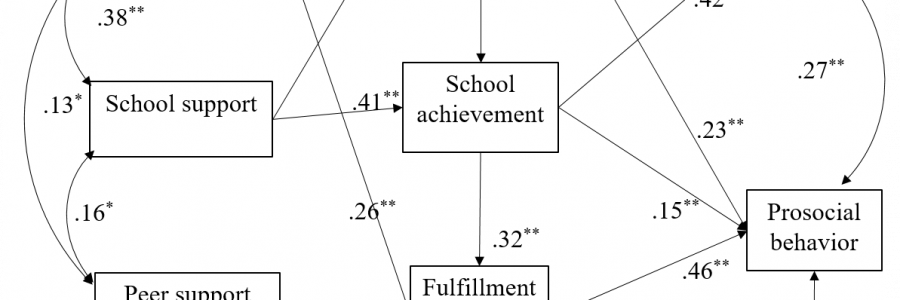
The power of SEM lies in the fact that it combines factor analysis and regression analysis. Thus SEM has two main components: the measurement paths and the structural paths. Path analysis refers to the structural paths and will be introduced on Day 1. We will also cover mediation analysis and the correct use of regression models, depending on features of the outcome variable. We will fit and discuss an assortment of models in Mplus.

Schedule:

  • Session 1: The SEM process
  • Session 2: Path analysis with mediated effects
  • Session 3: The different types of regression models
  • Session 4: Recap and Quiz


The programme is from 10am-5pm, split into 4 sessions of 1-1.5 hours each. Click on the other “bubbles” above to see the schedule for each day.
Day 2

Day 2

Factor analysis

The power of SEM lies in combining factor analysis with path analysis. Our instruments (e.g., questionnaires) most often rely on multiple indicators that attempt to tap into an unobserved underlying trait. With factor analysis we use information obtained from responses to items of the questionnaire to obtain insights into the underlying trait. As opposed to simple sum-scores, factor analysis is a more accurate representation of reality. Factor analysis comes in two flavours: exploratory and confirmatory.

Day 2 covers both EFA and CFA, alongside with the specification of a full SEM.

Schedule:

  • Session 1: Introduction to factor analysis
  • Session2: Exploratory and Confirmatory factor analysis
  • Session 3: Structural equation modelling
  • Session 4: Recap and Quiz
Day 3

Day 3

Multiple-group analysis

Research on differences between groups usually warrants two main research questions: ‘Are the average levels of a construct different between groups?’ and “Is the strength of the relationship between 2 (or more) constructs different between groups?”. But to answer both of these questions, the researcher must first ensure that the constructs measured function equivalently across groups. Can one truly conclude that 2 groups differ in a construct if it is revealed that the 2 groups under investigation interpreted the questionnaire differently?

Day 3 covers multiple group analysis and includes both information about measurement equivalence (i.e. invariance) and how to answer the main research questions of multiple-group studies.

Schedule:

  • Session 1: Multiple-group analysis and invariance testing
  • Session 2: Measurement invariance
  • Session 3: Structural invariance and Moderated mediation
  • Session 4: Recap and Quiz
Day 4

Day 4

SEM with longitudinal data

Structural equation modelling with longitudinal data can be a powerful tool in understanding behaviour over time. Although often disregarded, longitudinal invariance is essential for models where one wishes to compare mean levels over time and models depicting individual trajectories over time. Indeed, if the questionnaire was not interpreted in the same way at different time-points, how can one conclude that any observed differences in scores represented true differences?

In addition to providing an introduction to modelling using Mplus and explaining longitudinal invariance, Day 4 provides insights into path analysis with longitudinal data, auto-regressive (including cross-lagged) models and longitudinal mediation analysis.

Schedule:

  • Session 1: Auto-regressive models and Longitudinal mediation
  • Session 2: Longitudinal Confirmatory Factor Analysis
  • Session 3: Longitudinal CFA with measurement invariance constraints
  • Session 4: Recap and Quiz
Day 5

Day 5

Modelling individual trajectories over time

Modelling individual trajectories over time is one of the most interesting and revealing techniques that can be applied to longitudinal data. It can provide information about the general pattern of people’s behaviour and attitudes, as well as each person’s individual trajectory over time. This can then be incorporated into structural equation models to better understand the extent to which a variety of antecendents translate into steeper increases or decreases of a behaviour over time.

Day 5 covers latent growth curve models (linear, quadratic and piecewise) and further builds on these models to show how to answer research questions that pertain to the development and mutual relationship between 2 (or multiple) psychological constructs, as well as questions about predictors and outcomes of individual trajectories.

Schedule:

  • Session 1: Introduction to latent growth curve models
  • Session 2: The trajectory shape
  • Session 3: Dual growth models and Growth models with covariates
  • Session 4: Recap and Quiz
Day 6

Day 6

Group-based trajectories

Sometimes a single average trajectory doesn’t equally well describe your entire sample. In this case, it is likely that different sub-groups exist, each sub-group having its own trajectory of behaviour / attitudes over time. This is where group-based trajectory modelling comes in.

Day 6 covers the main tenets of identifying sub-groups of people with specific developmental trajectories over time and explains the difference between several major technique variations: growth mixture models, latent class growth analysis, latent profile analysis, longitudinal latent class analysis, etc. It also explains how you can use information on each person’s “profile” (i.e. trajectory group membership) to further build models that include covariates/predictors and outcomes.

Schedule:

  • Session 1: Introduction to group-based trajectory modelling
  • Session 2: Latent Class Growth Analysis and Growth Mixture Models
  • Session 3: Group-based trajectories with covariates; Further topics
  • Session 4: Recap and Quiz